

Below are some examples of my first seven months as Design Editor at the New York Post. The Front Page This seven […]
Category: infographic

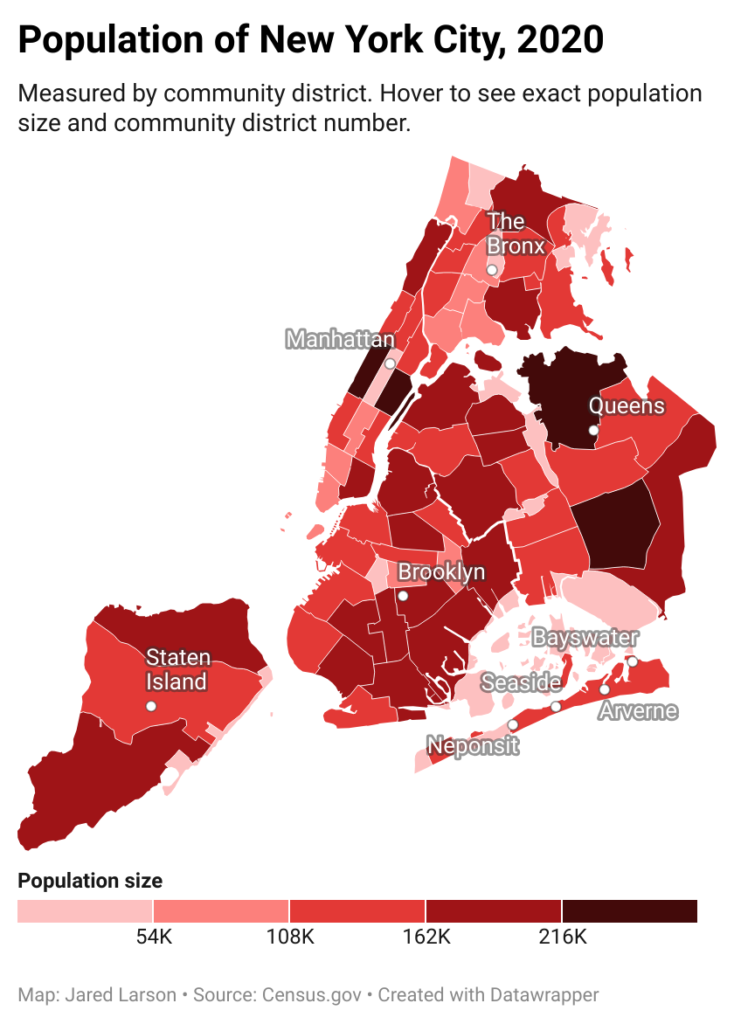
Data visualization: Individuals living in DHS shelter system, affordable housing units and vacancy rate in NYC
Click through the slideshow below to view data visualizations on individuals living in DHS shelters, affordable housing units and vacancy rate. Hover/click […]
Jared Larson materials for New York Post Design Editor
Design 1 — Static and animated map showing current control in Russo-Ukrainian War Sources: Data used from Liveuamap.com, cross-referenced with Deepstatemap.live and […]
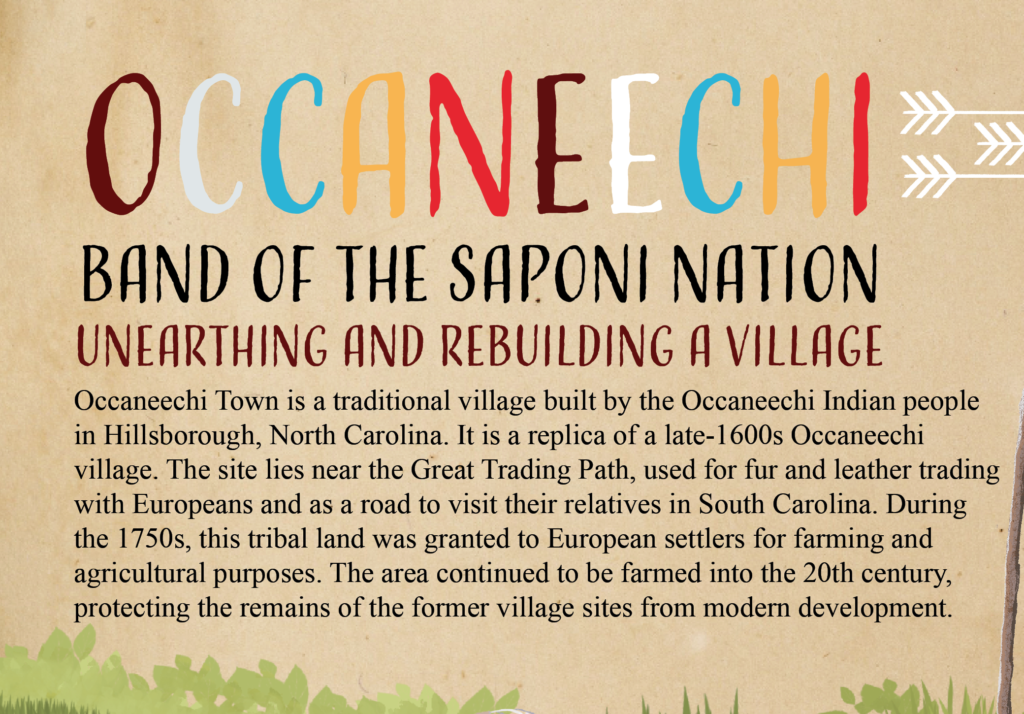
Rebuilding an Occaneechi Village
This infographic details the discovery, building and upkeep of a replica Occaneechi village in Hillsborough, North Carolina. The illustrations were painted in […]
Demographics of Food Deserts in US
This two-page infographic is aimed to convey a breadth of information regarding who live in food deserts and, thus, live with food […]
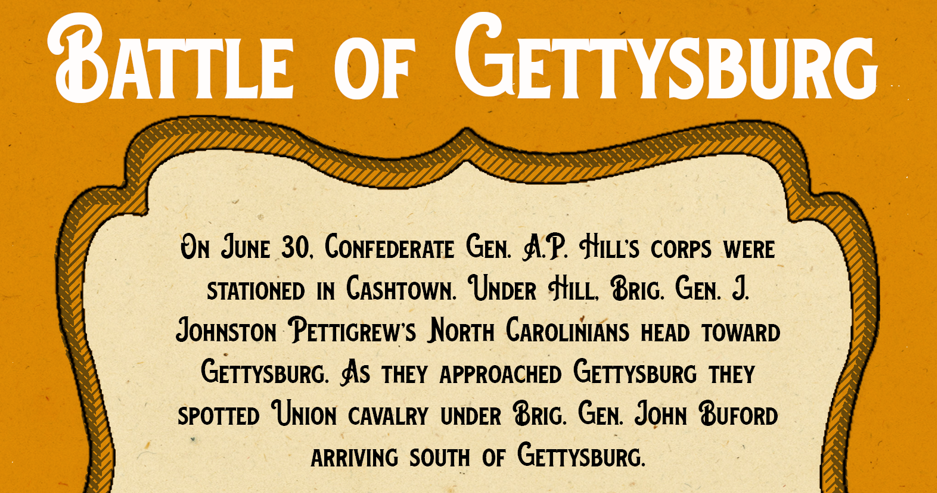
Battle of Gettysburg Infographic
This infographic aims to provide a nuanced look at the Battle of Gettysburg, one of the most important and deadliest battles in […]

Hummingbird infographic
This infographic was created by painting assets in Adobe Photoshop and compiling/tweaking in Adobe Illustrator.